目录
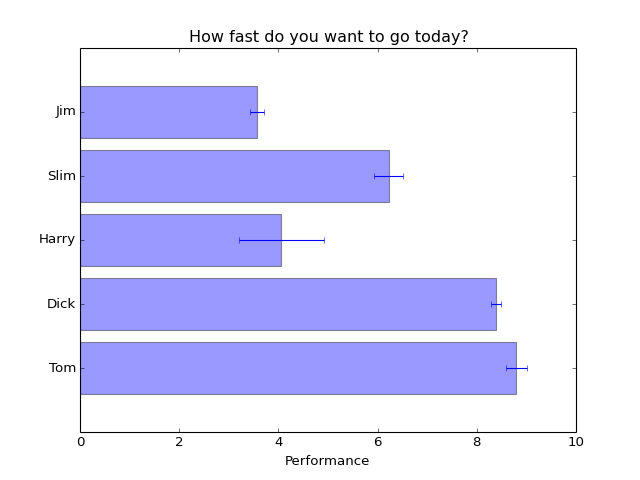
1.水平柱状图
lines bars and markers example code: barh demo.py
 1 #coding:utf-8
 2 """
 3 Simple demo of a horizontal bar chart.
 4 """
 5 import matplotlib.pyplot as plt; plt.rcdefaults()
 6 import numpy as np
 7 import matplotlib.pyplot as plt
 8 # Example data
 9 people = ('Tom', 'Dick', 'Harry', 'Slim', 'Jim')#定义一组数据
10 y_pos = np.arange(len(people))#arange类似range不过返回的是array
11 performance = 3 + 10 * np.random.rand(len(people))#随机生成每个人的表现
12 error = np.random.rand(len(people))
13
14 plt.barh(y_pos, performance,height=0.6,xerr=error, align='center', alpha=0.1)
15 #创建一个horizontal bar
16 """barh(bottom, width, height=0.8, left=0, **kwargs)
17 bottom:底部坐标
18 width:横向长度
19 height:柱的宽度
20 """
21 plt.yticks(y_pos, people)#y坐标
22 plt.xlabel('Performance')#x轴名称
23 plt.title('How fast do you want to go today?')#表名
24
25 plt.show()#显示图片
1.matplotlib.pyplot.rcdefaults()
Restore the default rc params. These are not the params loaded by the rc file, but mpl’s internal params. See rc_file_defaults for reloading the default params from the rc file
2.matplotlib.pyplot.barh(bottom, width, height=0.8, left=None, hold=None, **kwargs)
info:Make a horizontal bar plot
3.matplotlib.pyplot.yticks(*args, **kwargs)
4.matplotlib.pyplot.xlabel(s, *args, **kwargs)
5.matplotlib.pyplot.title(s, *args, **kwargs)
1.np.arange()
To create sequences of numbers, NumPy provides a function analogous to range that returns arrays instead of lists
2.np.random.rand()
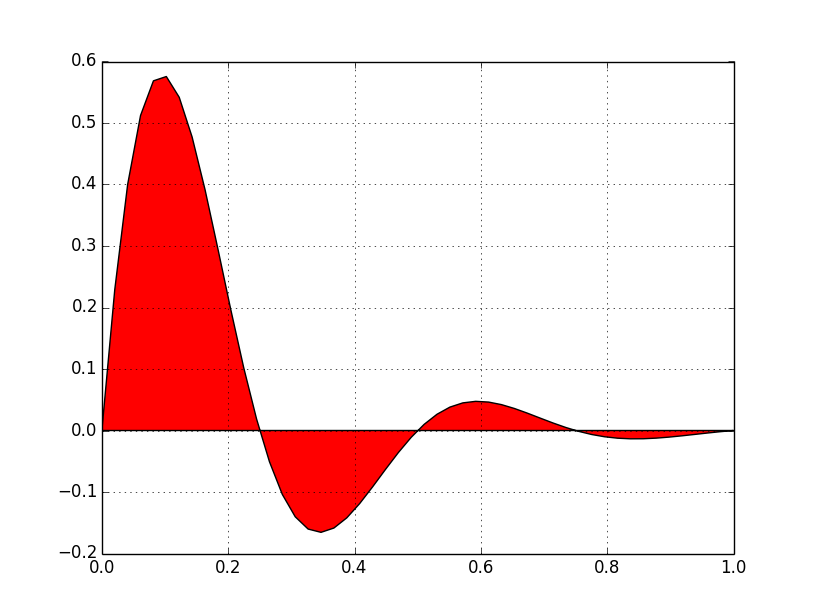
2.填充曲线
lines bars and markers example code: fill demo.py
 1 #coding:utf-8
 2 """
 3 Simple demo of the fill function.
 4 """
 5 import numpy as np
 6 import matplotlib.pyplot as plt
 7
 8 x = np.linspace(0, 1)#0-1等步长
 9 y = np.sin(4 * np.pi * x) * np.exp(-5 * x)#sin(4*pi*x)*x^-5
10
11 plt.fill(x, y, 'r') #使用红色填充填充
12 plt.grid(True) #打开网格
13 plt.show()
1.matplotlib.pyplot.fill(*args, **kwargs)
2.plt.grid(True)
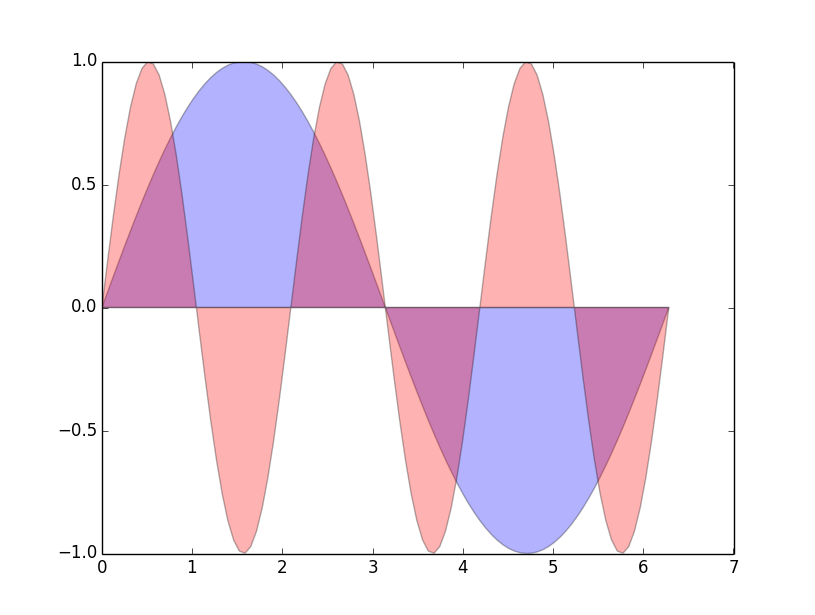
3.多图叠加
lines bars and markers example code: fill demo features.py
 1 #coding:utf-8
 2 """
 3 Demo of the fill function with a few features.
 4
 5 In addition to the basic fill plot, this demo shows a few optional features:
 6
 7     * Multiple curves with a single command.
 8     * Setting the fill color.
 9     * Setting the opacity (alpha value).
10 """
11 import numpy as np
12 import matplotlib.pyplot as plt
13
14 x = np.linspace(0, 2 * np.pi, 100)#(0,2*pi),100等分
15 y1 = np.sin(x)
16 y2 = np.sin(3 * x)
17 plt.fill(x, y1, 'b', x, y2, 'r', alpha=0.3)#把两个曲线画在一张图上
18 #plt.grid(True)
19 plt.show()
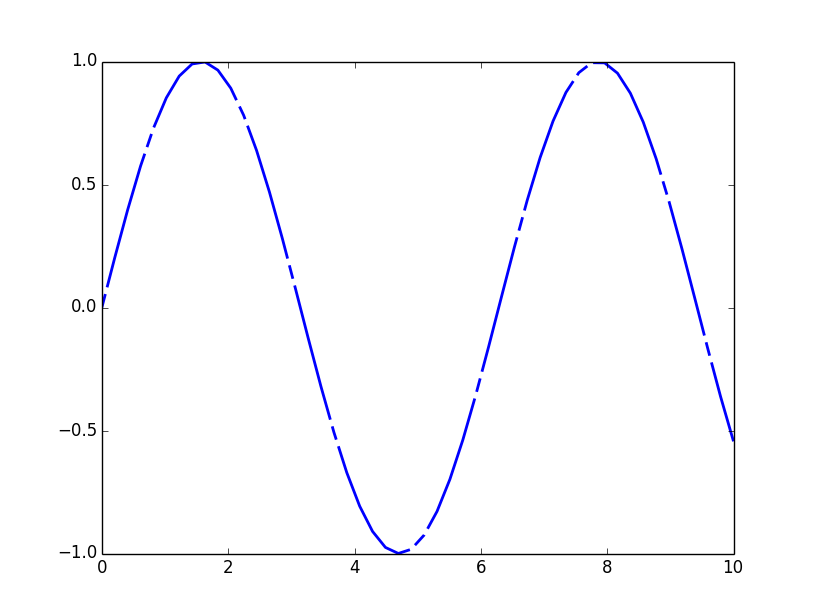
4.虚线和自定义虚线
lines bars and markers example code: line demo dash control.py
 1 #coding:utf-8
 2 """
 3 Demo of a simple plot with a custom dashed line.
 4
 5 A Line object's ``set_dashes`` method allows you to specify dashes with
 6 a series of on/off lengths (in points).
 7 """
 8 import numpy as np
 9 import matplotlib.pyplot as plt
10
11 x = np.linspace(0, 10)#0-10等步长
12 line, = plt.plot(x, np.sin(x), '--', linewidth=2)
13
14 dashes = [10, 5, 100, 5] # 10 points on, 5 off, 100 on, 5 off 设置长横和短横
15 line.set_dashes(dashes)#按照dashes自定义虚线
16
17 plt.show()
1.line.set_dashes(dashes)
2.plt.plot(x, np.sin(x), '--', linewidth=2)
info:.plot